Here are some of the new features within the Consolidation module in Dynamics 365 Business Central:
Exchange Rates
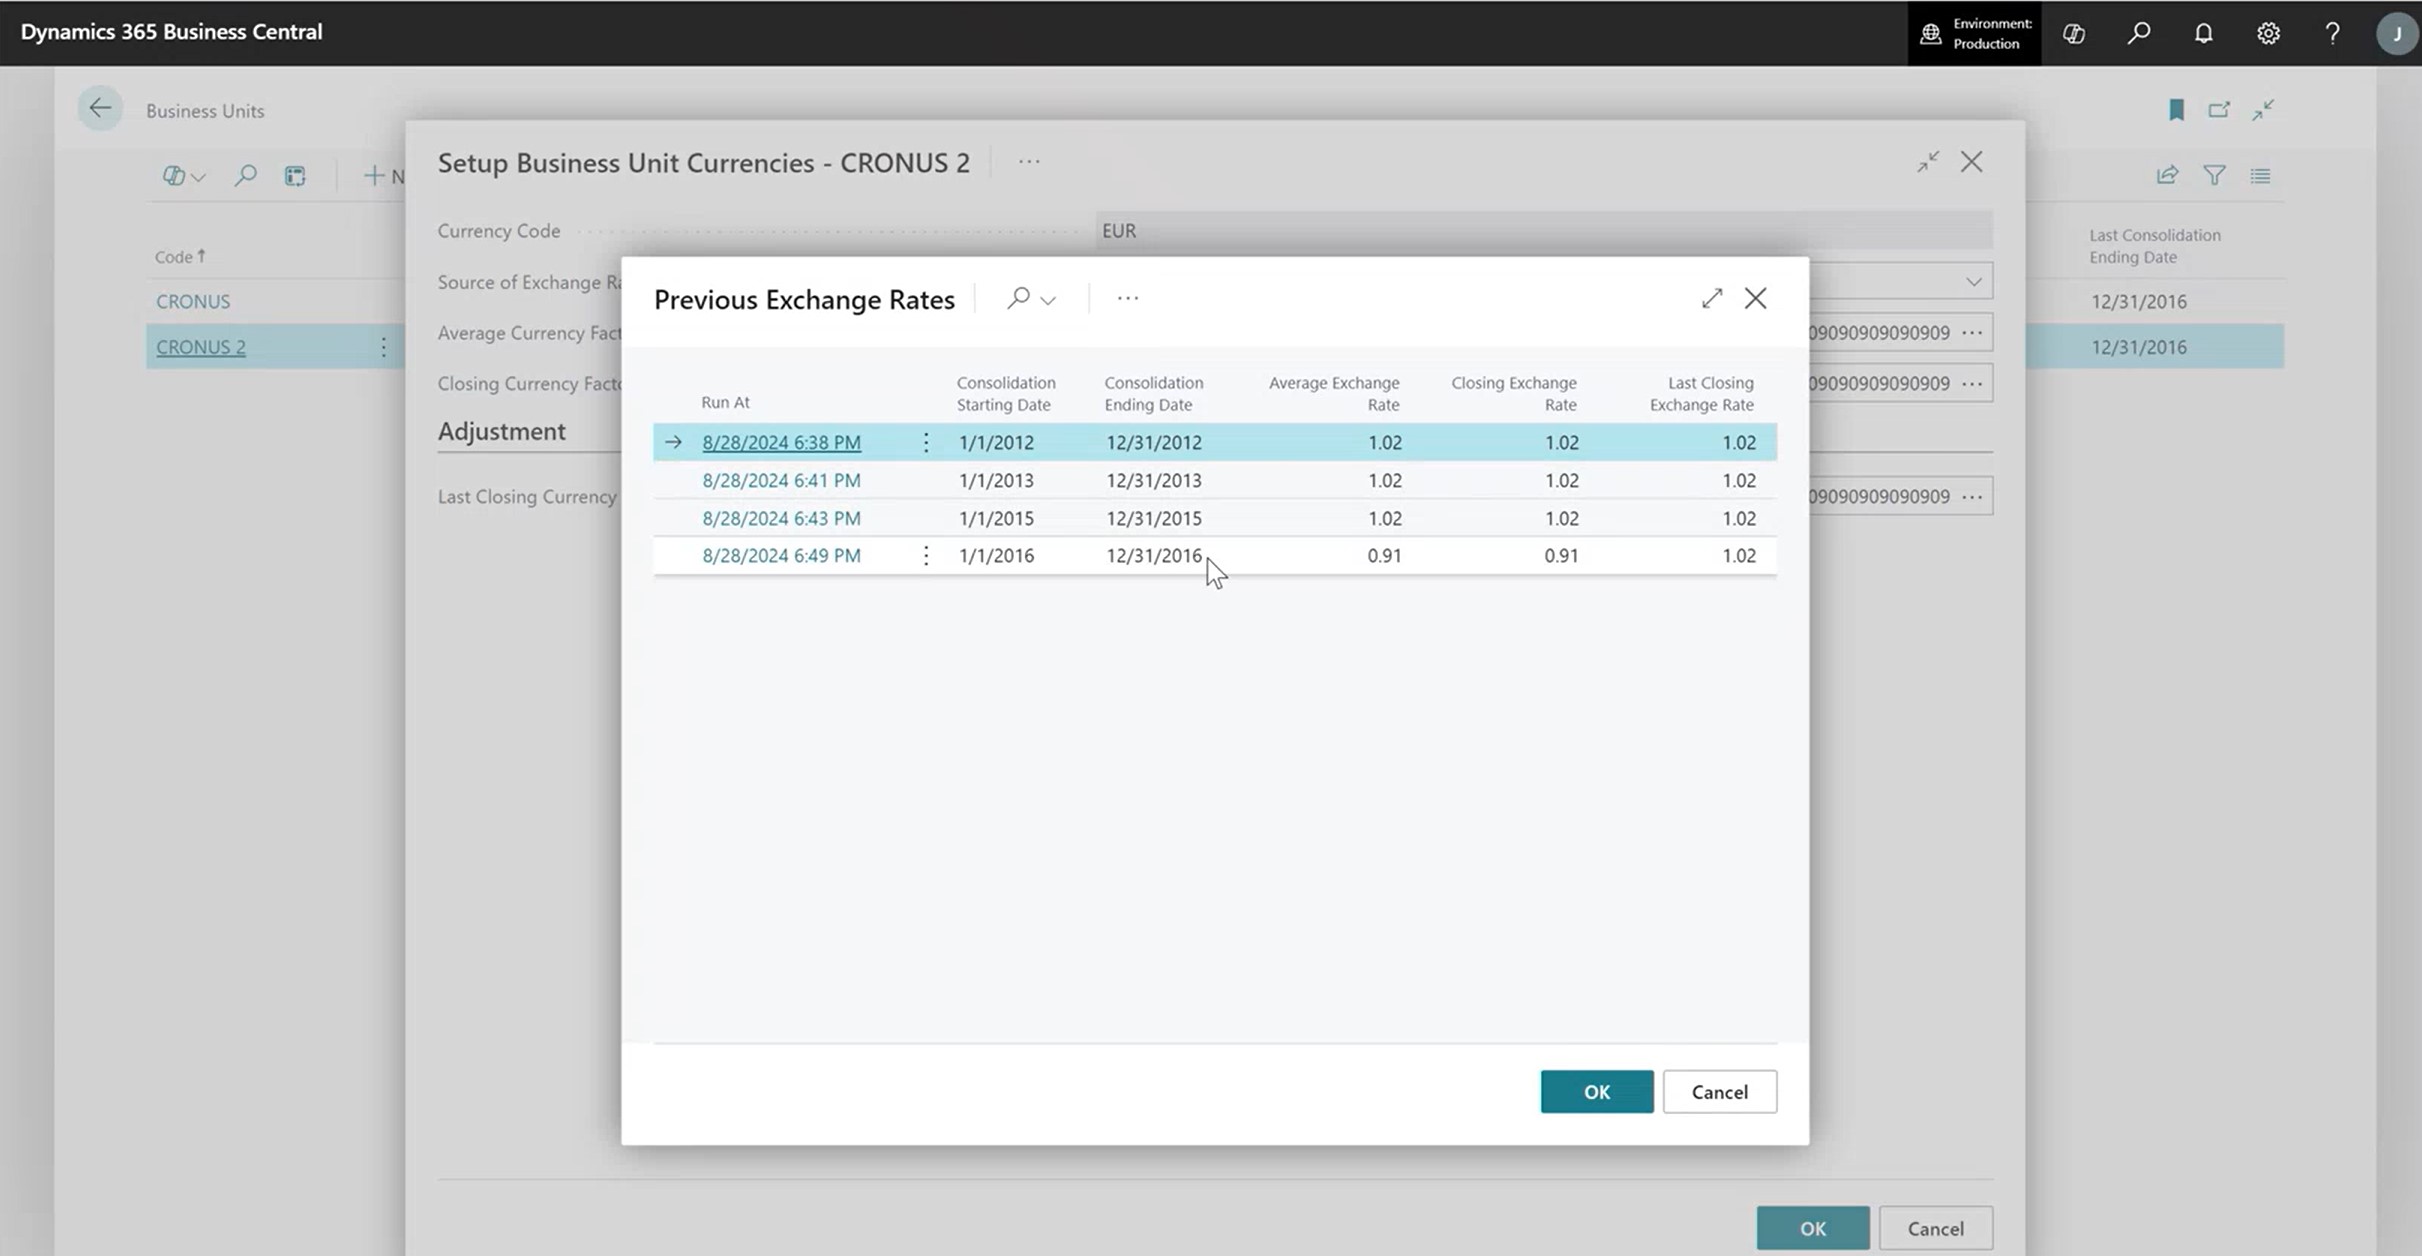
The exchange rates are on one page now instead of multiple pages. It makes entering the exchange rates a little bit easier.
You can also see the historical exchange rates – the rates you have used in a prior period.

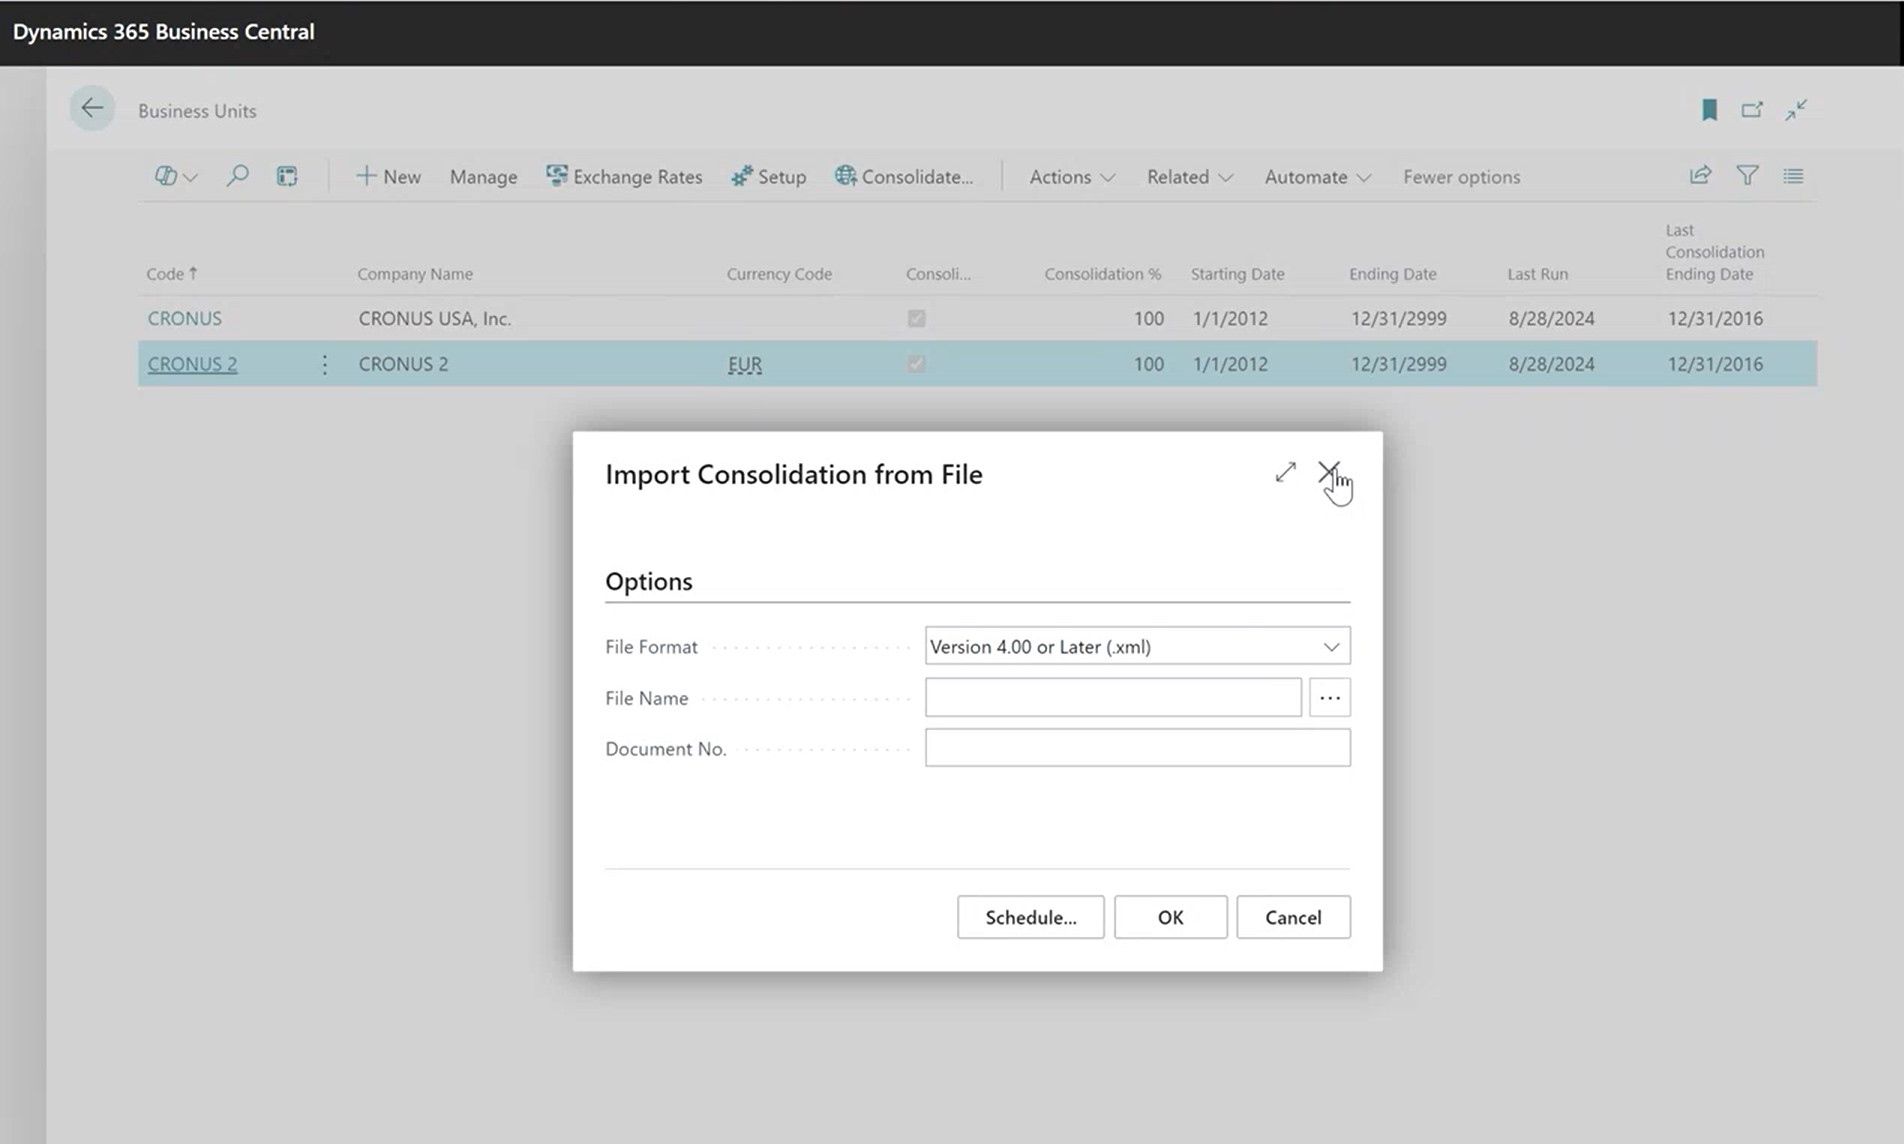
Export and Import Consolidation
Microsoft has changed the way you map to a specific company when consolidating. You can either point it to an existing company within the same environment or in a separate environment or a separate file. You can connect through an API or export the file from another company and import it.

How to Report on Consolidation using OData and Excel
In Dynamics 365 Business Central, Trial Balance (4) is a native report available to report on consolidation. But this report only allows for up to three columns for the separate companies and then a column for the total. So, if you have more than three kinds of subsidiaries, using Odata might be another tool to report information across multiple companies and view consolidated financial statements.
One of them is using the GL Entries (Page 20 in Dynamics 365 Business Central). You can personalize the General Ledge Entries Page to add the Business Unit Code field. You can export this page and create a pivot table and build a trial balance by Business Unit or create a Web Service pointing to Page 20 to get the same information but directly in Excel by Company.
That’s one way to look at mainly journal entries by company, but you may also want to look at other data by company. Only the GL entries are moved into the consolidation company. All the sub-ledger details like vendor invoices, customer invoices and PO’s doesn’t get moved over. So, there’s no real good way to look at your open PO’s across all companies or your posted invoices across all companies. You can view this with OData.
Below is an example of the Posted Purchase Invoices (Page 138). You can check in your Web Services for something that is pointing to Page 138 or add a new Web Service and then reference Page 138.
When you go into the Power Query Editor in Excel, you can create two data sources or multiple data sources all pointing to the same page. You can expand the lines in the Excel sheet to pull in both the header and line data.
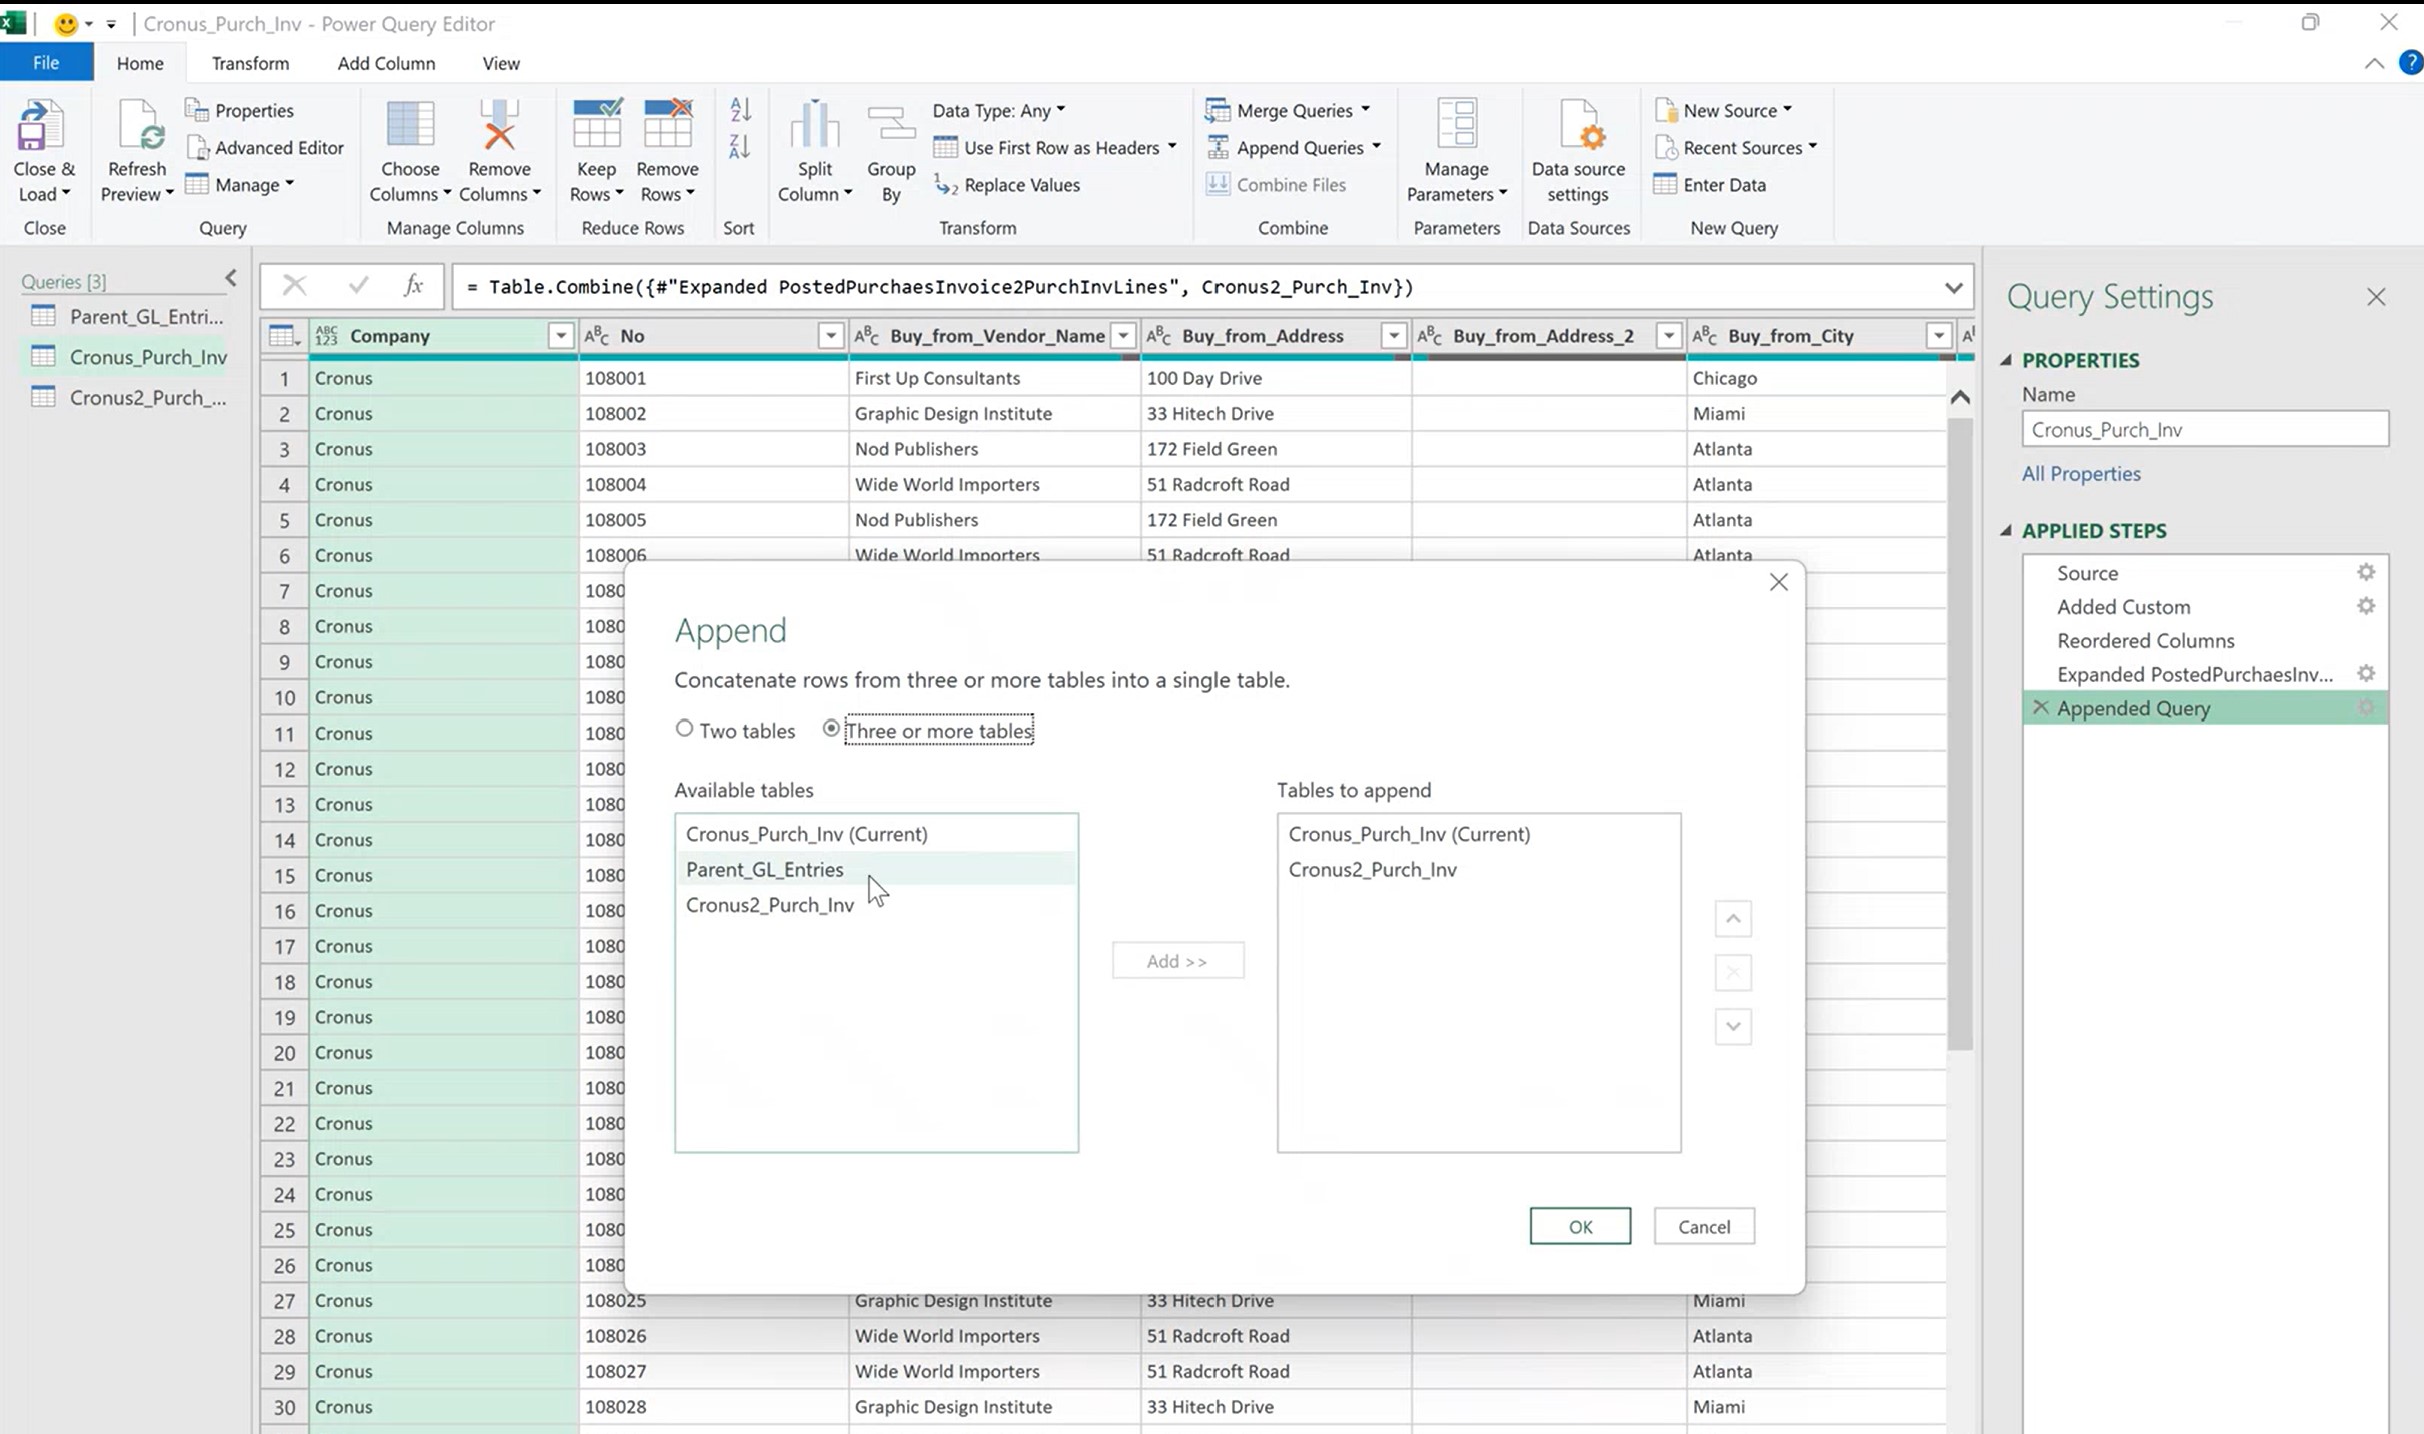
In the screenshot below, you can see that I created a data source for Cronus and another company Cronus2 and appended the queries.

You can either append it to the existing query or create a new one to get them all combined. You can choose the tables you want to combine, either just two tables or you can combine many tables together. So, if you have 10 subsidiaries, you can combine all 10 subsidiaries here.
As long as the data types, the field names and number of fields are the same in both queries, it will just naturally stack them. You can also add a custom column for the Company Name. This way when you combine them, you get listing of invoices for both companies in one query. This works for any web service or table or page you are trying to combine across companies.
The idea is to create a Web Service for the page that you want and then create a query for each company and append all of them into a single query to get a consolidated view of transactions across all your subsidiaries.
If you want something more at a subsidiary level, you can append multiple web services from multiple companies into one result.
To learn more about the functionalities in Dynamics 365 Business Central, visit https://dynamics.tensoft.com/ or contact us today!
– Jason has over 20 years of financial leadership experience in high growth technology companies. He is a Microsoft Certified Dynamics 365 Business Central Functional Consultant Associate. See Credential.