 Of all the new features in the latest release of Microsoft Dynamics 365 Business Central, Analyze View is probably my favorite one. With this feature, you can analyze data from list pages within the application itself, essentially turning it into a pivot table.
To do something like this in the past, you would have to create an OData feed in Excel and maybe do a pivot table on top of that or go into Power BI and create a pivot table. All those are great tools. Analyze view is sort of another avenue of reporting. The main benefit is that there is no need to switch applications. Creating an analysis view is intuitive, especially if you’ve worked with pivot tables in Excel. I think a lot of customers are going to be happy with this feature.
How to Build an Analysis Report:
- Open List Type Page
- Enable Analyze Option
- Enable Pivot Mode
- Select Row, Column and Values
- Select Filters
Example: If you go to into your General Ledger Entries, you’ll see this new option ‘Analyze’ available to you. At first, you’ll see the normal list page, but once you turn on the ‘Analyze’ toggle switch, it turns it into the analyze view. You’ll see tabs across the top. You can rename these, and it saves them for a particular user right now. Hopefully this will be enhanced so that these views can be shared across multiple users, sort of publish them as shared or private.
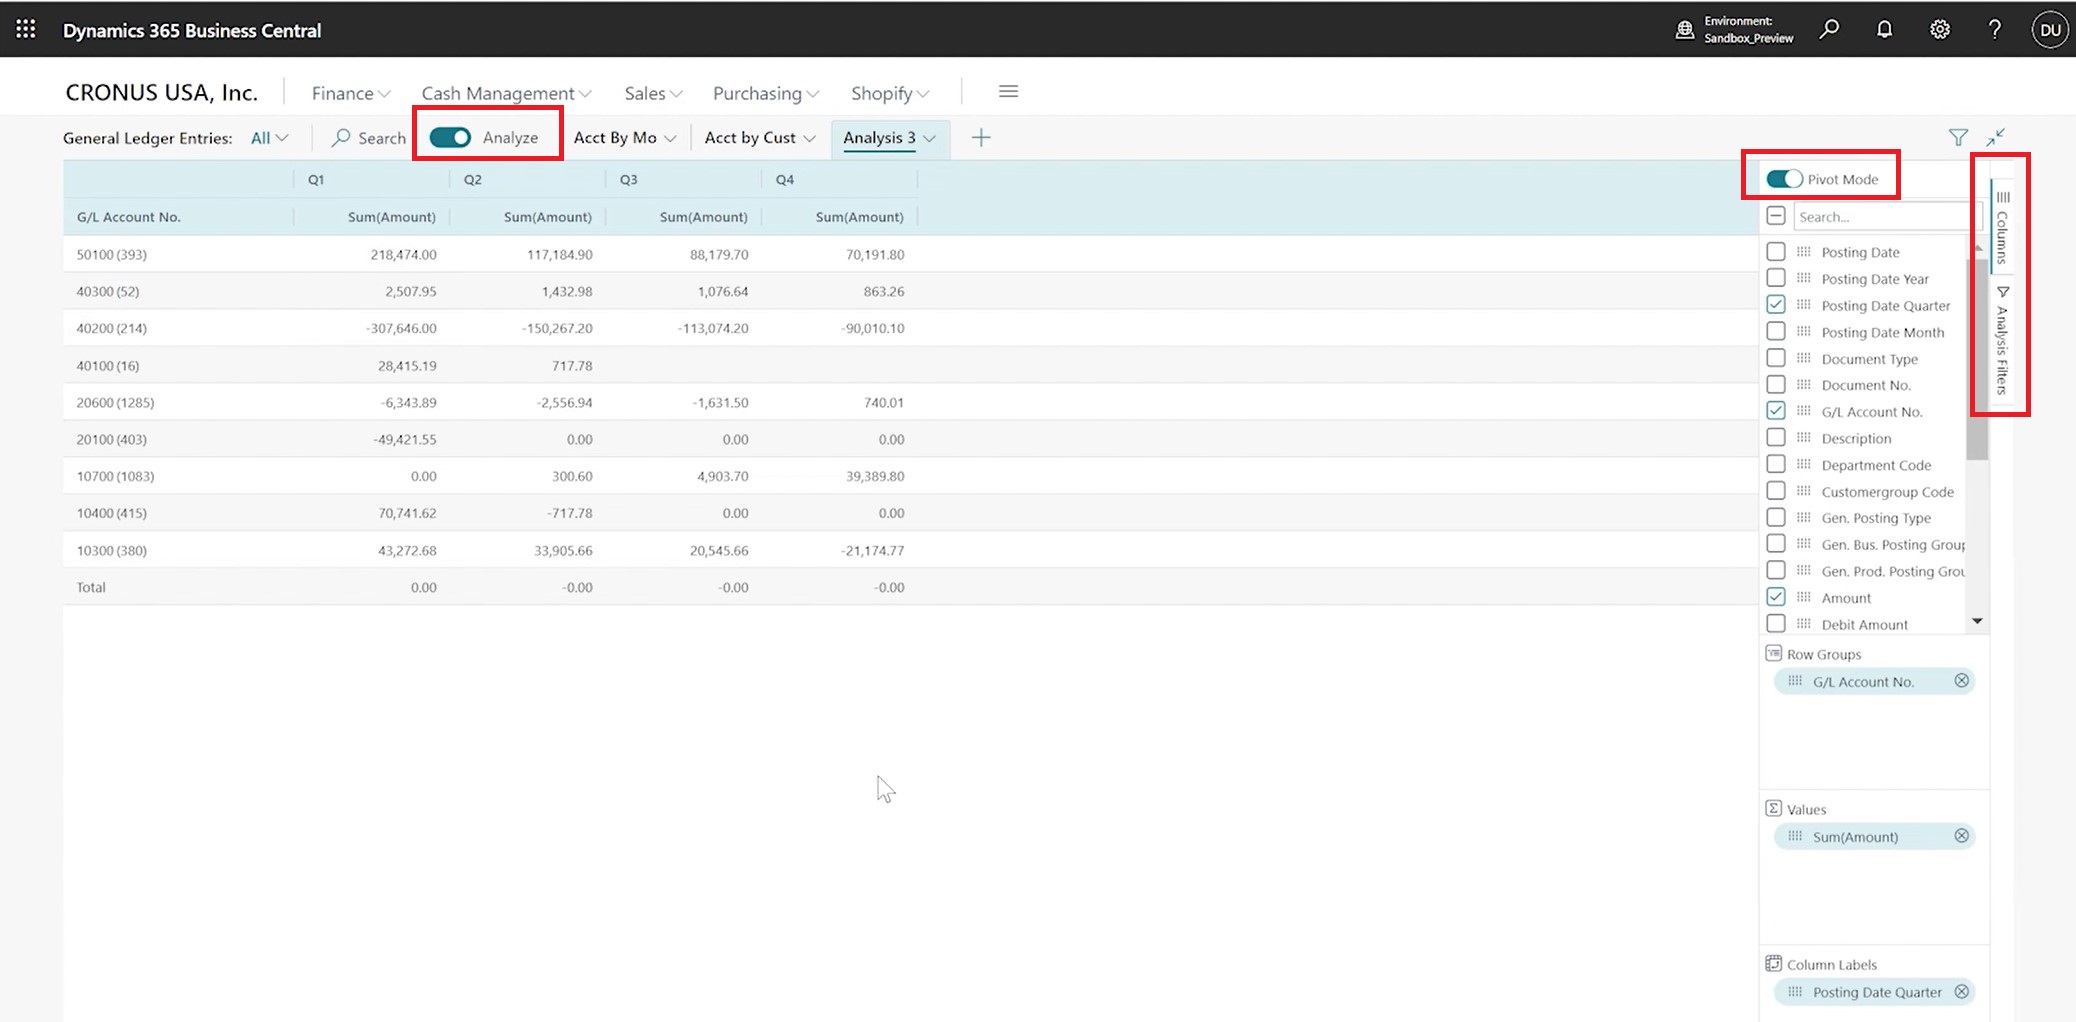
On the right side of the screen, you’ll see Columns and Analysis Filters. Open Columns and then turn on Pivot Mode. Here you’ll see the rows, columns, and values just like you would see in any pivot table. You can pick G/L Account No. as your row, and then Posting Date Quarter as your column. You’ll see the transactions –revenue or cost by quarter. You can do it by month or by year or by dimension or by customer. Lots of different values depending on what you’re analyzing. This feature is available on most screens but not all.
If you close the General Ledger Entries page and go back in, you’ll see the regular list format by default. Once you turn Analyze on, you’ll see your different analysis views and within each view you can add filters. One of the most obvious ones is going to be the Posting Date. You can add a filter within a certain range or before or after a certain date. You can also filter on account numbers or customers or vendors or departments. So, you might have like an R & D, SG&A type spending by line, by month in here.
Right now, you can’t drill into anything. Hopefully, Microsoft will enhance this by being able to drill into the transactions or the details behind them. There is a way to export it, but it is not very pretty. So, maybe different ways to export the data could be another enhancement. If you’re used to pivot tables, you can already imagine how useful this would be beyond just the standard list of transactions or documents or master data.
To learn more about the new features in this latest release, read this blog post.
– Jason has over 20 years of financial leadership experience in high growth technology companies. He is a Microsoft Certified Dynamics 365 Business Central Functional Consultant Associate. See Credential.