Last month, Tensoft hosted a webinar on “What’s New in Microsoft Dynamics 365 Business Central”. I covered some of the new features in the latest release related to reporting, user interface, multi-company management, etc. Below are some of the updates associated with reporting and analytics that you may find useful:
Analyze Data in Lists and Queries
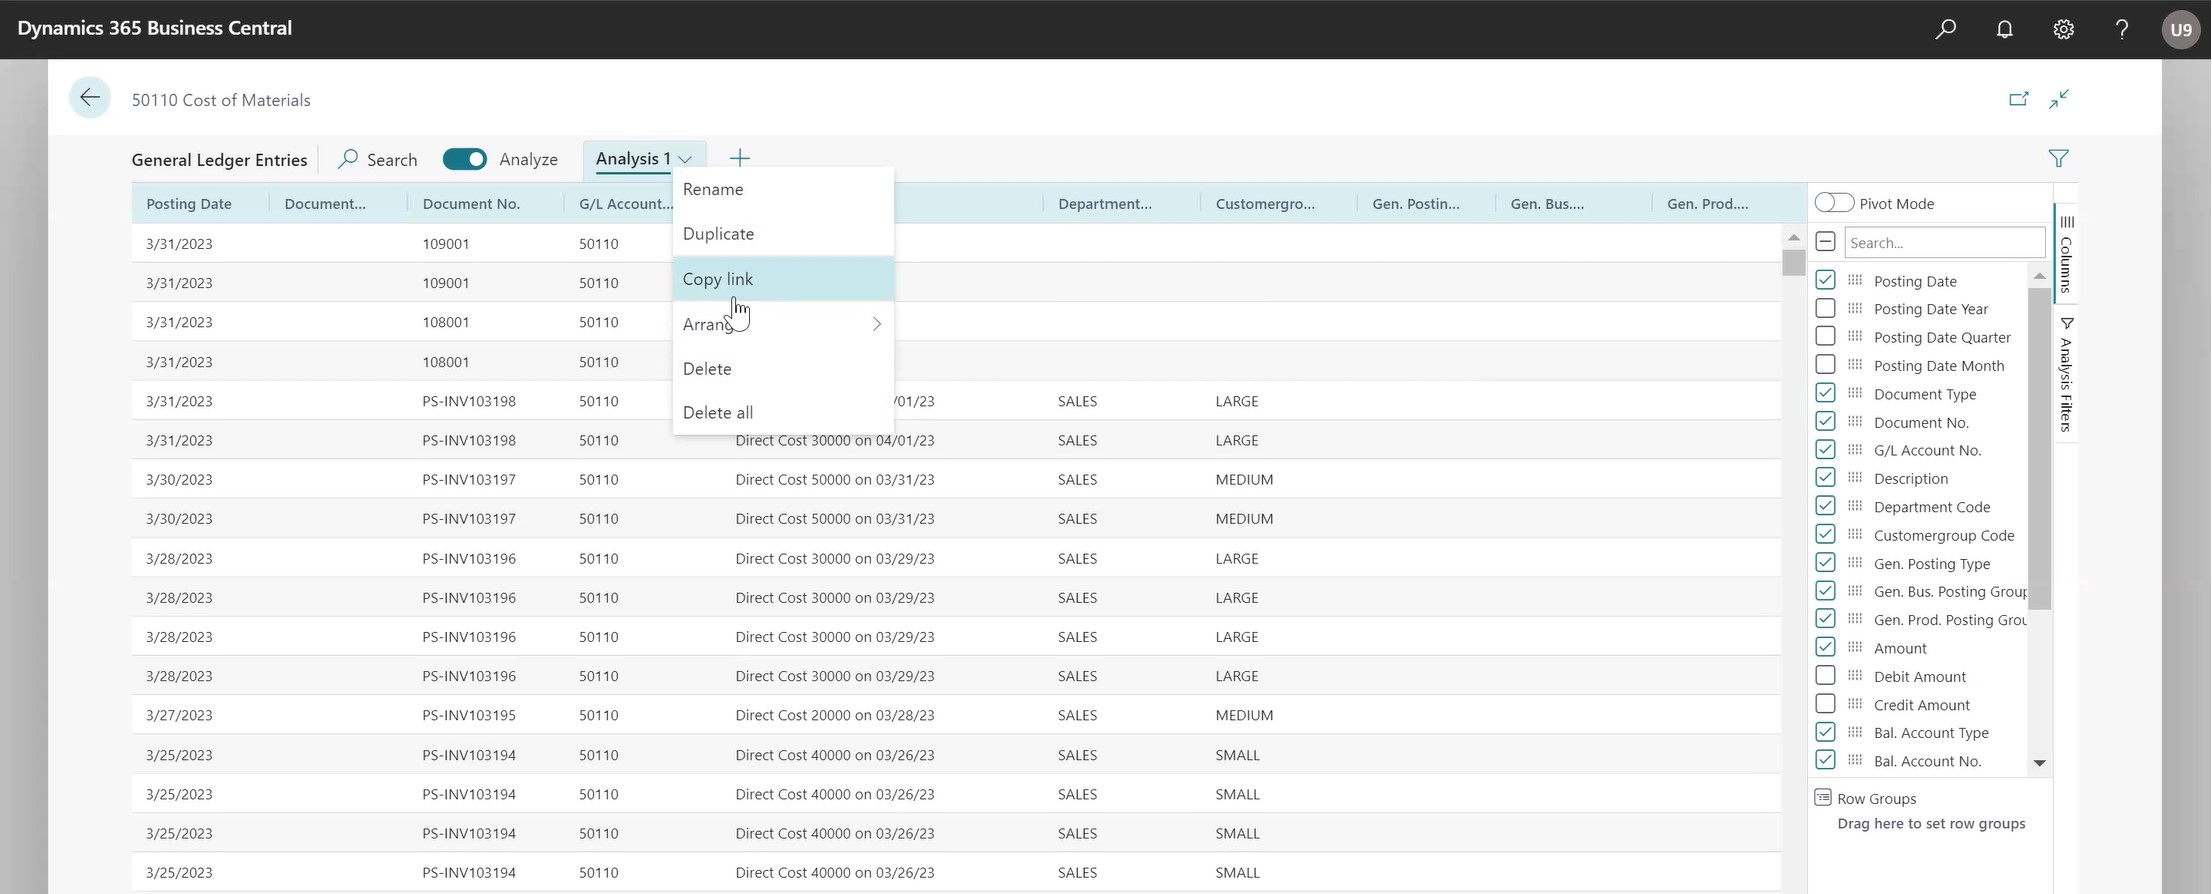
In 2023 wave 1 release, Microsoft added the Analyze View feature to analyze data directly within Business Central. This feature converts data into a pivot table, and you can sort and group things by amount or quantity to a pivot table by date, using either the pivot mode or summary list mode. Previously, you may have had to export it to Power BI or Excel for data analysis.
With this release, they’ve enhanced the way you can create tabs. You can create tabs, duplicate, and rename it. You can arrange it in a certain order. You can also copy the link and share it with somebody else.

Right now, it is specific for each user. But I suspect you’ll be able to save it and share it with your team in the future. Copy link is probably an interim step to share a nice report.
One of the other updates is the ability to join multiple tables together and use a query object behind it as a data source. You can also create a query in the background if a page doesn’t exist or if you want to combine multiple pages. For example, you can create a query or an analysis view of Customer Ledger entry and the Customer Master.
Enhancements to Edit in Excel
There are some enhancements to the Edit in Excel functionality in Business Central. You’ve probably used the Edit in Excel function, maybe on a journal entry. With this feature, you can either Open in Excel or Edit in Excel.
Open in Excel is a static report. So, you mainly would use that just to dump the data into Excel and create another report or distribute it in a different format.
Edit in Excel opens up an add-in. It is connected to Business Central, and you can make changes and write back to Business Central. This is good for uploading large journal entries, making mass changes, or adding some information to the customer master item record. It’s a quick way to make changes rather than making them on the screen. This feature has been around for a while. With this release, they’ve enhanced the performance. If you have filters on the source page, it applies them better when you export it to Excel. The dimensions are included on more pages as well.
Discover Report and Data Analysis Content Easily with Tell Me
With this release, Microsoft has added the ability to discover queries, reports, pages, and detailed records easily by using the search icon (Tell Me button).
For example, if you search for a customer, Adatum, in the Cronus database and click on Search Company Data, it will give your top records that may be related to that customer, the GL account, vendor, etc. It is a great way to search across all the different modules within Business Central at a record level, whereas a basic search is for pages and reports at a global level. You can use Alt+Q to quickly navigate to ‘Tell Me’ Page.
Stay tuned for our next blog post on the user interface updates in the latest release of Business Central!
– Jason has over 20 years of financial leadership experience in high growth technology companies. He is a Microsoft Certified Dynamics 365 Business Central Functional Consultant Associate. See Credential.