 Previously, we have covered the Custom Report Layouts and Odata Reporting in Microsoft Dynamics 365 Business Central. One of the other powerful ways of reporting Dynamics 365 Business Central information is Microsoft Power BI.
Power BI is a cost-effective web API tool with robust data analytics type functions. It’s very structured and does make good dashboards that can be published to web and shared with other users. It’s good for slicing and dicing and drilling in the data.
Data Sources in Dynamics 365 Business Central
To find out where the Data Sources come from, go to Web Services in Dynamics 365 Business Central. Here you will see a lot of built-in reports. If it’s published, it will have an OData URL and this is what Power BI or excel hooks into. You can add to this list. If there is a screen in Dynamics 365 Business Central that has data on it and you want to expose it to Power BI, you can find the Page name and add a record of it in here and then publish it. It will then be a data source for Power BI.
This is how you control what’s exposed to Power BI from Dynamics 365 Business Central.
Adding a Data Source in Power BI
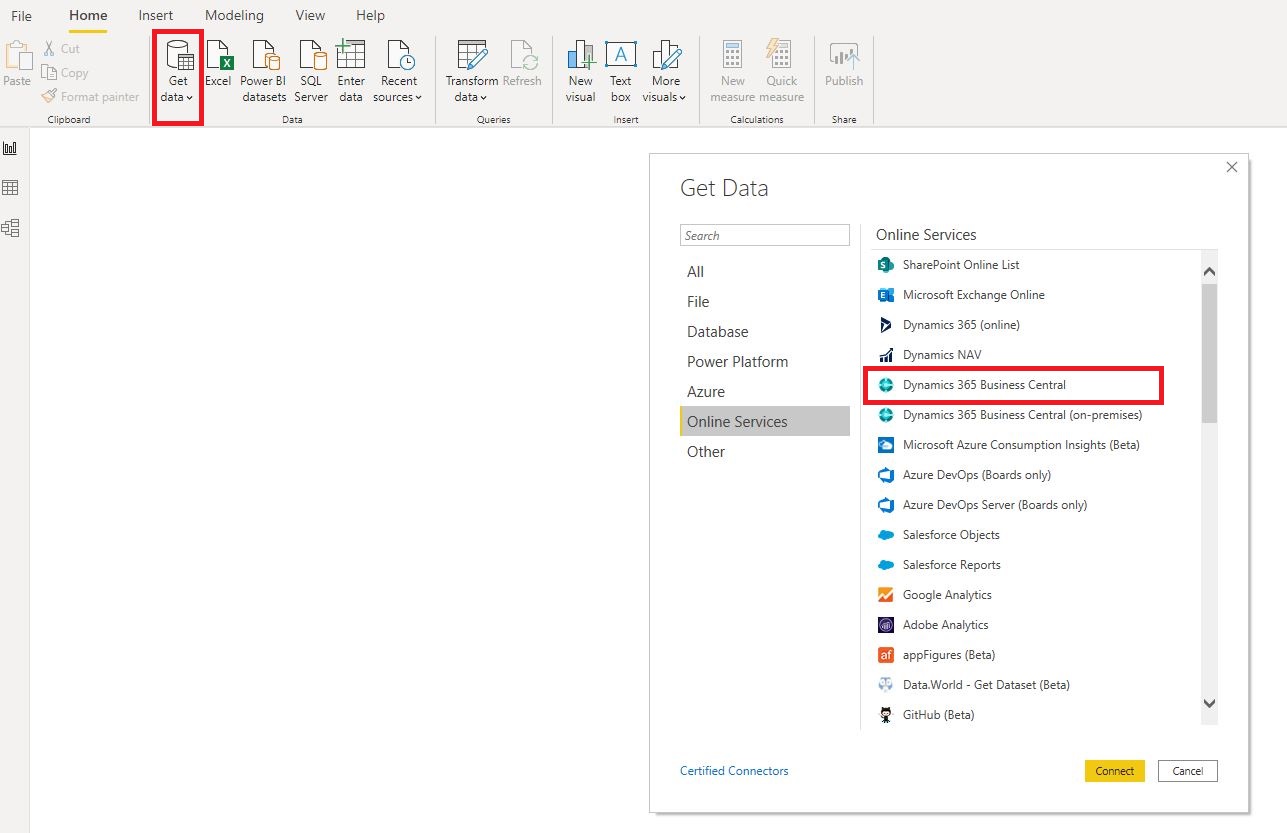
Download Power BI Desktop. Click on Get Data and then on Online Services. Here, click on Dynamics 365 Business Central and Connect.

If you are connecting it for the first time, it will ask for your credentials. Enter them and then it will give a list of all your environments, all the companies within each environment and all the data sources within each company. Here, you will see the page that you saw in Dynamics 365 Business Central. These are all the queries and tables that are available to Power BI.
Select the one you want and click on Load. It will grab the data for that source and the table will show all the Fields that are available.
You can pull data from different data sources – for example, ‘Invoices’ from Dynamics 365 Business Central and ‘Shipments’ for Tensoft SemiOps (or any other modern cloud application) – and combine them. You can have any number of tables you want and create a relationship between the tables, whatever is the key that links them together you can define it.
Once you have the data from all the sources, you can start building your Power BI report.