In Microsoft Dynamics 365 Business Central, the financial reports are available in a nice almost printable format especially if you know how to export it and refresh it with your own formatting. But sometimes, you need the raw data quickly in a Pivot Table format or a Power BI refreshable report for data analysis.
To get this data, navigate to the ‘Financial Report KPI Web Service Setup’ page (In 2022 release wave 2, financial reporting replaced account schedules). Here, you can select the financial reports you want to expose to Excel/Power BI. By default, it just includes the ones that come with the standard out of the box. If you have any custom ones, which most of the companies do, you will need to add it here. You can look at the ‘Help’ to see some of the options available on this page. For example- the View By determines if we want it by month/quarter/year/week/day.
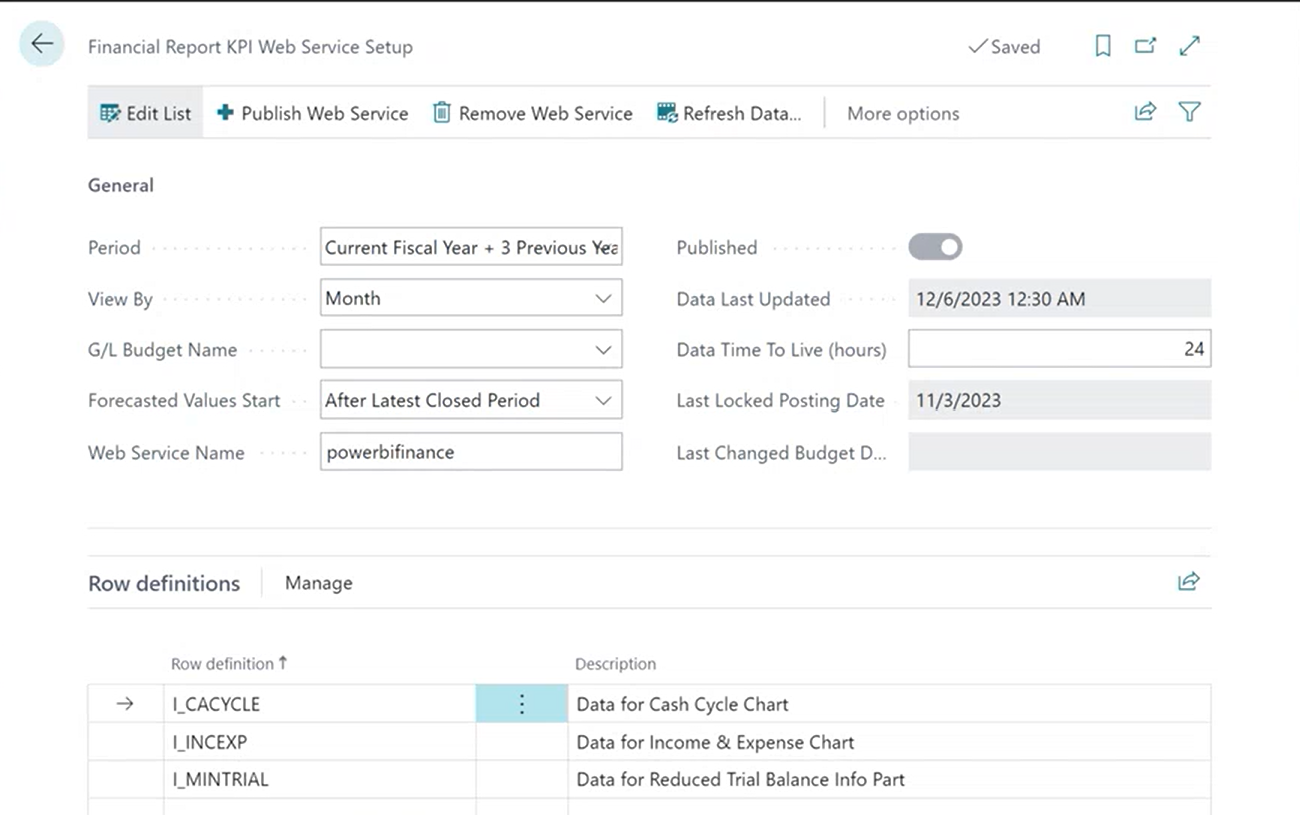
Once you have this setup and have selected the Financial Report that you want to expose, navigate to the Web Services page. Search for Financial Report KPI Web Service. Copy the OData URL and create connection in Excel or Power BI.
In Excel, click on > Data > Get Data > From Other Sources > From Odata Feed > Paste it in there. If you’ve done this before, it will automatically show you the financial report and give you an option to Load. If not, there’ll be an authentication, click on Organizational Account and then enter your Microsoft credentials- the same ones that you use to login to Business Central. You’ll see all the lines that you have in Financial Report by period.
It is a list of all that we selected. It will have a bunch of different values like Net Change for your P&L, Balance Sheet at that particular date, change versus last year, etc. The neat thing about this is all the calculations that you have in that financial report are already calculated in here.
You can now create a pivot table. The screenshot below shows a simple summarized example where it includes revenue, cost of sales, gross profit and expense. If you want, you can create a more detailed one with G&A, by departments or by functional area. You can just refresh the data from here.
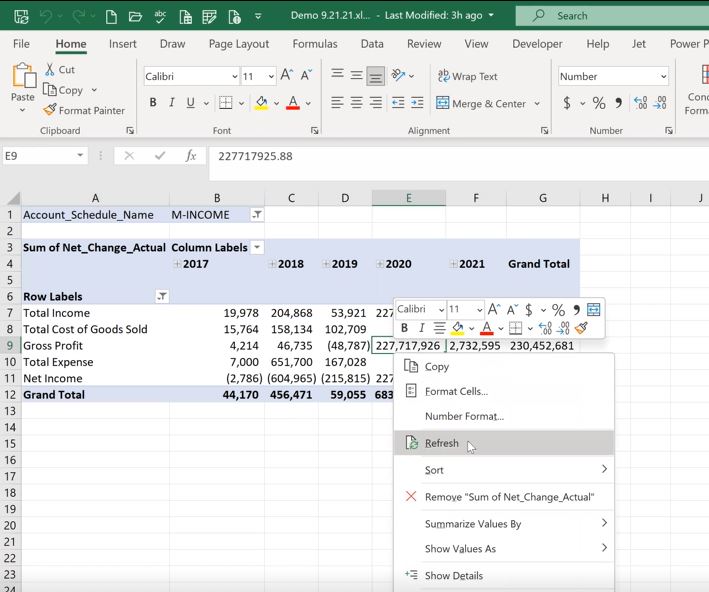
This is a quick way to get your financial report into excel in more of a pivot table format. You may find this very useful for data analysis.
For more information on the other functionalities in Dynamics 365 Business Central, contact us.
– Jason has over 20 years of financial leadership experience in high growth technology companies. He is a Microsoft Certified Dynamics 365 Business Central Functional Consultant Associate. See Credential.